Distill: A Journal With Interactive Images for Machine Learning Research

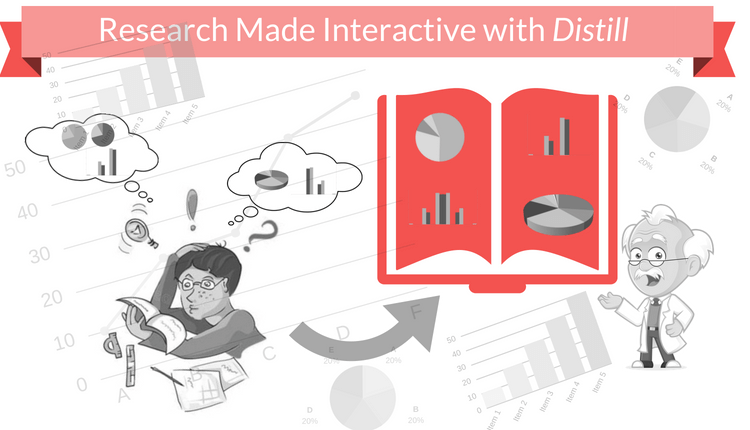
Research is a wide and extensive field of study. This field has welcomed a plethora of individuals looking to explore, learn, and create value for civilization over the years. However, the lack of interactive visuals is a challenge that has plagued the research field for an extended period of time. Not only is this frustrating for researchers, but it also becomes a challenge for the readers.
The nature of the publication medium severely restricted interactive visualization like figures and graphical representations. A few minds at Google got together to change that. In 2017, Google launched a journal named Distill. The journal of figures and tables intends to nurture and promote visual and interactive content for machine learning research. Let us learn about the journal in details.
How is Distill Useful to the Academic Community?
Researchers could understand the research of their colleagues only through printed paper and PDFs. The dearth of interactive visualization made research a truly challenging exercise. Scientists and researchers did their part with traditional methods and then through computer programming. However, there was no uniformity or formalization of these efforts in the past. Now the times have changed. As a researcher, you can move ahead and submit your research in a way that it gets formally published and retains the benefits of visual interaction. Distill is the journal that enables this.
Tackling the Challenge of Figures and Graphs
Generally, in a research paper or journal, a printed graph or figure remains stationary. There is no way to actually interact with the figure or graph to understand it better. A researcher would want to know its nature, functionality, and the consequences of making any changes. This was an issue for inquisitive minds for years.
Distill effectively solved this through its use of visually interactive content. Now, you can actually play around with models, change constraints and inputs, and see how it affects the output. This is especially helpful in working with figures and graphs. Researchers and users can actually interact with figures and get the extensive support that they have been seeking for ages.
Distill Publishing vs. Conventional Publishing
Publishing in Distill is a much more elaborate process than conventional publishing. This difference is not due to different color calibrations from the conventional route, but because of the efforts that go into publishing in Distill. The team openly invites joint publications, because they are well aware of the challenges.
Each publication in Distill requires immense effort and several hours of work. The publication contains textual and interactive content. There are no word count limits for any article type. The articles published in Distill are peer reviewed and appear in Google Scholar. Distill is also registered with the Library of Congress and CrossRef.
The due diligence done in the process of publishing is how Distill is not different from the conventional route. Distill has high standards for screening content. Content is rejected if it does not meet the set standards. Moreover, publications are reviewed by experts, who treat them just like conventional publications. Hence, publications are essentially the best of both worlds with a better pay off for the reader base.
A Commendable Initiative
Google Distill is a commendable initiative to help out the scientific and research community. Not only it addresses the most basic issues of research, but also brings figures and graphical representations under its umbrella. This is a major step in the direction of solving more complex problems. Distill has effectively made publishing research a significantly more rewarding task for the researcher and the readers.
What is your opinion on this journal on interactive figures? How beneficial do you think it will be for the academic community? Please share your thoughts with us in the comments section below.


