Quick Guide to Biostatistics in Clinical Research: Regression Analysis

We have been looking at various ways in which statistics is essential in all clinical trial phases. We have examined hypothesis testing, error types, p-values, power, sample size determination, and multiplicity issue. Can we use biostatistics to determine how a set of independent variables influence an outcome?
When clinical studies are conducted, researchers may wish to know what factors are influencing the observed effect. This type of question can be answered using regression analysis. There are many types of regression analyses. A linear regression involves one independent variable and the outcome variable. This should be used to model a relationship between data if the dependent variable is continuous and approximately normal. A multiple regression involves two or more independent variables that are expected to influence the outcome variable. A logistic regression would be used to model data if the dependent variable is dichotomous. In each case, the data analysis is being done to model any statistical relationship between the dependent and independent variables.
Multiple Regression Analysis
As an example, you may have a theory that asthmatic patients who live in polluted areas and who have smokers in their homes use more asthma medication than those who don’t. A multiple regression analysis could be used to find out if there is an actual association between smokers in the household and air pollution and how often patients have an asthma attack. In this case, the number of inhalers purchased in a time period would be used as the dependent variable. The independent variables that are influencing this outcome would be air pollution and presence of a smoker in the house.
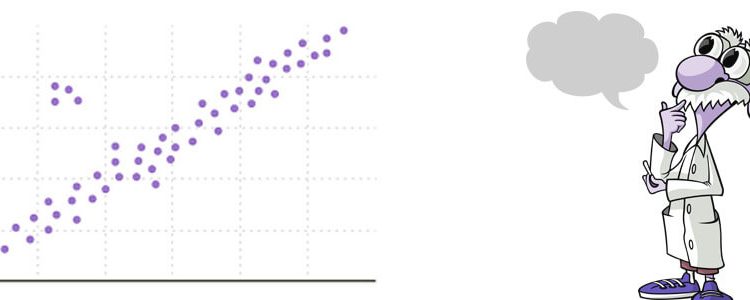
You would collect data from asthmatic patients about the number of inhalers purchased and find out if any member of their household smokes. You would also collect data about the air quality in the neighborhood where each patient lives. A statistical program, such as SPSS or R would be used to plot a relationship among these three variables. The program would draw a regression line. The regression line approximates the relationship among the variables. It is the best explanation of their relationship. The statistical program will also give you a formula that explains the relationship. Usually, it would have the format
Y = mx + c + error term.
Y is the dependent variable (number of inhalers purchased in a year). X is the independent variable, and c is a constant. The error term indicates how confidently the relationship can be predicted. The smaller the error term, the more certain you can be of the regression line. M is a factor that indicates the influence of x.For instance, if m = 10 and X
For instance, if m = 10 and X1 represented the impact of smoking and X2 represented the impact of air pollution on triggering asthma attacks, you could say that for patients who live in an area with very clean air and no smokers in the family, the number of inhalers purchased in a year would be c. For every unit increase in air pollution and number of smokers, the asthmatic patient is exposed to; the number of inhalers purchased in a year will increase by 10.
The measure r2 is a fraction of the variation in dependent variable that is explained by the regression model. In other words, the r2 value associated with your regression analysis will tell you how much of the relationship has been explained by the regression model. An r2 value of 52% for this asthma study (considering only impact of air pollution) would indicate that air pollution explain 52% of the variability in the number of inhalers asthmatics buy. This would suggest that there are other factors that we need to include to explain a larger proportion of the variation observed.
A Note of Caution
It is a common mistake in medical research to use biostatistics incorrectly. If you use regression analyses to identify a relationship among variables, you should not stop there. Ask, “Does this relationship make sense?” One may need to design additional experiments to test the regression relationship in the real world. It is also critical to remember that correlation does not equal causation. For instance, you may find that more people drown during a heat wave. It would be incorrect to say that heat waves cause drowning. Probing the relationship some more might reveal that more people go to the beach during heat waves, increasing the likelihood of drowning.
During this series, we have seen few of the ways in which biostatistics can help us answer clinical research questions. Regardless of the clinical trial phase, statistics can be helpful. We can use biostatistics for everything from testing a hypothesis, to correctly interpreting the p-value, to avoiding the multiplicity curse. It is always important to remember that the results of a statistical test should be viewed critically. Does this result align with the known biology? Do additional experiments need to be designed to further test the statistical association? Biostatistics is just a tool – those who conduct clinical trials should make sure that it is used properly and that the results are aligned with critical thinking.


