Simplifying Statistics: How and when to use correlation and regression?

Statistical tools provide a framework for accurate data interpretation. This makes them an indispensable element in research. Two fundamental statistical operations are correlation and regression which are commonly employed to explore relationships between variables.
However, these concepts are often confused due to their similarities. Correlation measures the strength and direction of relationships, while regression goes a step further and models the relationship, predicting the outcome. Both correlation and regression are invaluable for early-career researchers, scientists, postdocs, and academics to analyze data effectively. In this article, we take a closer look at them and understand when to use them.
What is Correlation?
Correlation is a statistical measure that refers to a process for establishing the relationships between two variables. It is the most common approach to measure the association between variables.
Correlation indicates how one variable changes in response to another– whether they increase, decrease together, or show no relationship. It is measured as a correlation coefficient (r) which ranges from -1 to 1.
- r close to 0 indicates a weak or minuscule relationship between the variables, such as the amount of study time and exam scores.
- r equals 1 shows a perfect positive correlation, which means if one variable increases, the other increases (both variables move in the same direction). For instance, the temperature in Celsius and Fahrenheit, where an increase in Celsius results in an increase in Fahrenheit.
- r equals -1 shows a perfect negative correlation, which means as one variable decreases, the other increases (both variables move in the opposite direction). This can be observed in the case of the time taken to reach a destination, where faster speeds reduce travel time.
Correlation provides insights into patterns without making predictions or assumptions about causality. Here, causality refers to the relationship where changes in an independent variable directly cause changes in the dependent variable. Listed below are a few types of correlation.
1. Pearson Correlation:
Checks how strongly two continuous variables are linearly related. It works best when data follows a normal distribution.
2. Spearman Correlation:
Measures the relationship between ranked data. It should be used when the data doesn’t fit Pearson’s requirements, like when the relationship isn’t straight-line but still follows a consistent direction.
3. Kendall Correlation:
Looks at how two variables are related in rank order. It is often for smaller datasets or when working with ordinal data.
It must be noted that though they estimate the association between variables, they do not indicate causation. This is where regression comes in.
What is Regression?
Regression is a statistical method to model the relationship between one dependent variable (the outcome) and one or more independent variables (the predictors). It allows researchers to predict the value of one variable based on the value of another. This can further help identify the factors influencing the dependent variable to estimate trends.
Regression finds the best line to predict y from x. Regression coefficients can be calculated in two ways: y on x (byx) and x on y (bxy). If one coefficient is greater than 1, the other will be less than 1. Their geometric mean equals the correlation coefficient (r), but their arithmetic mean can be greater than or equal to r. Listed below are a few types of regression.
1. Linear Regression:
Models the relationship between a dependent variable and one independent variable using a straight line. Use this when the relationship is linear. Since, all real-world regression models involve multiple predictors, the term linear regression often describes multivariate linear regression. Consider predicting a person’s weight based on their height using a straight-line relationship, which won’t hold in real-life situations.
2. Non-linear Regression:
Models relationships where the dependent variable does not change linearly with the independent variables. Use this when data shows exponential, logarithmic, or other non-linear trends. An example of this would be modelling the acceleration of a chemical reaction caused by an increase in temperature.
3. Multiple Regression:
Involves two or more independent variables predicting the dependent variable. This is useful when examining more complex relationships. Predicting the value of a house based on factors like size, location, and age of the property is a good example of multiple regression.
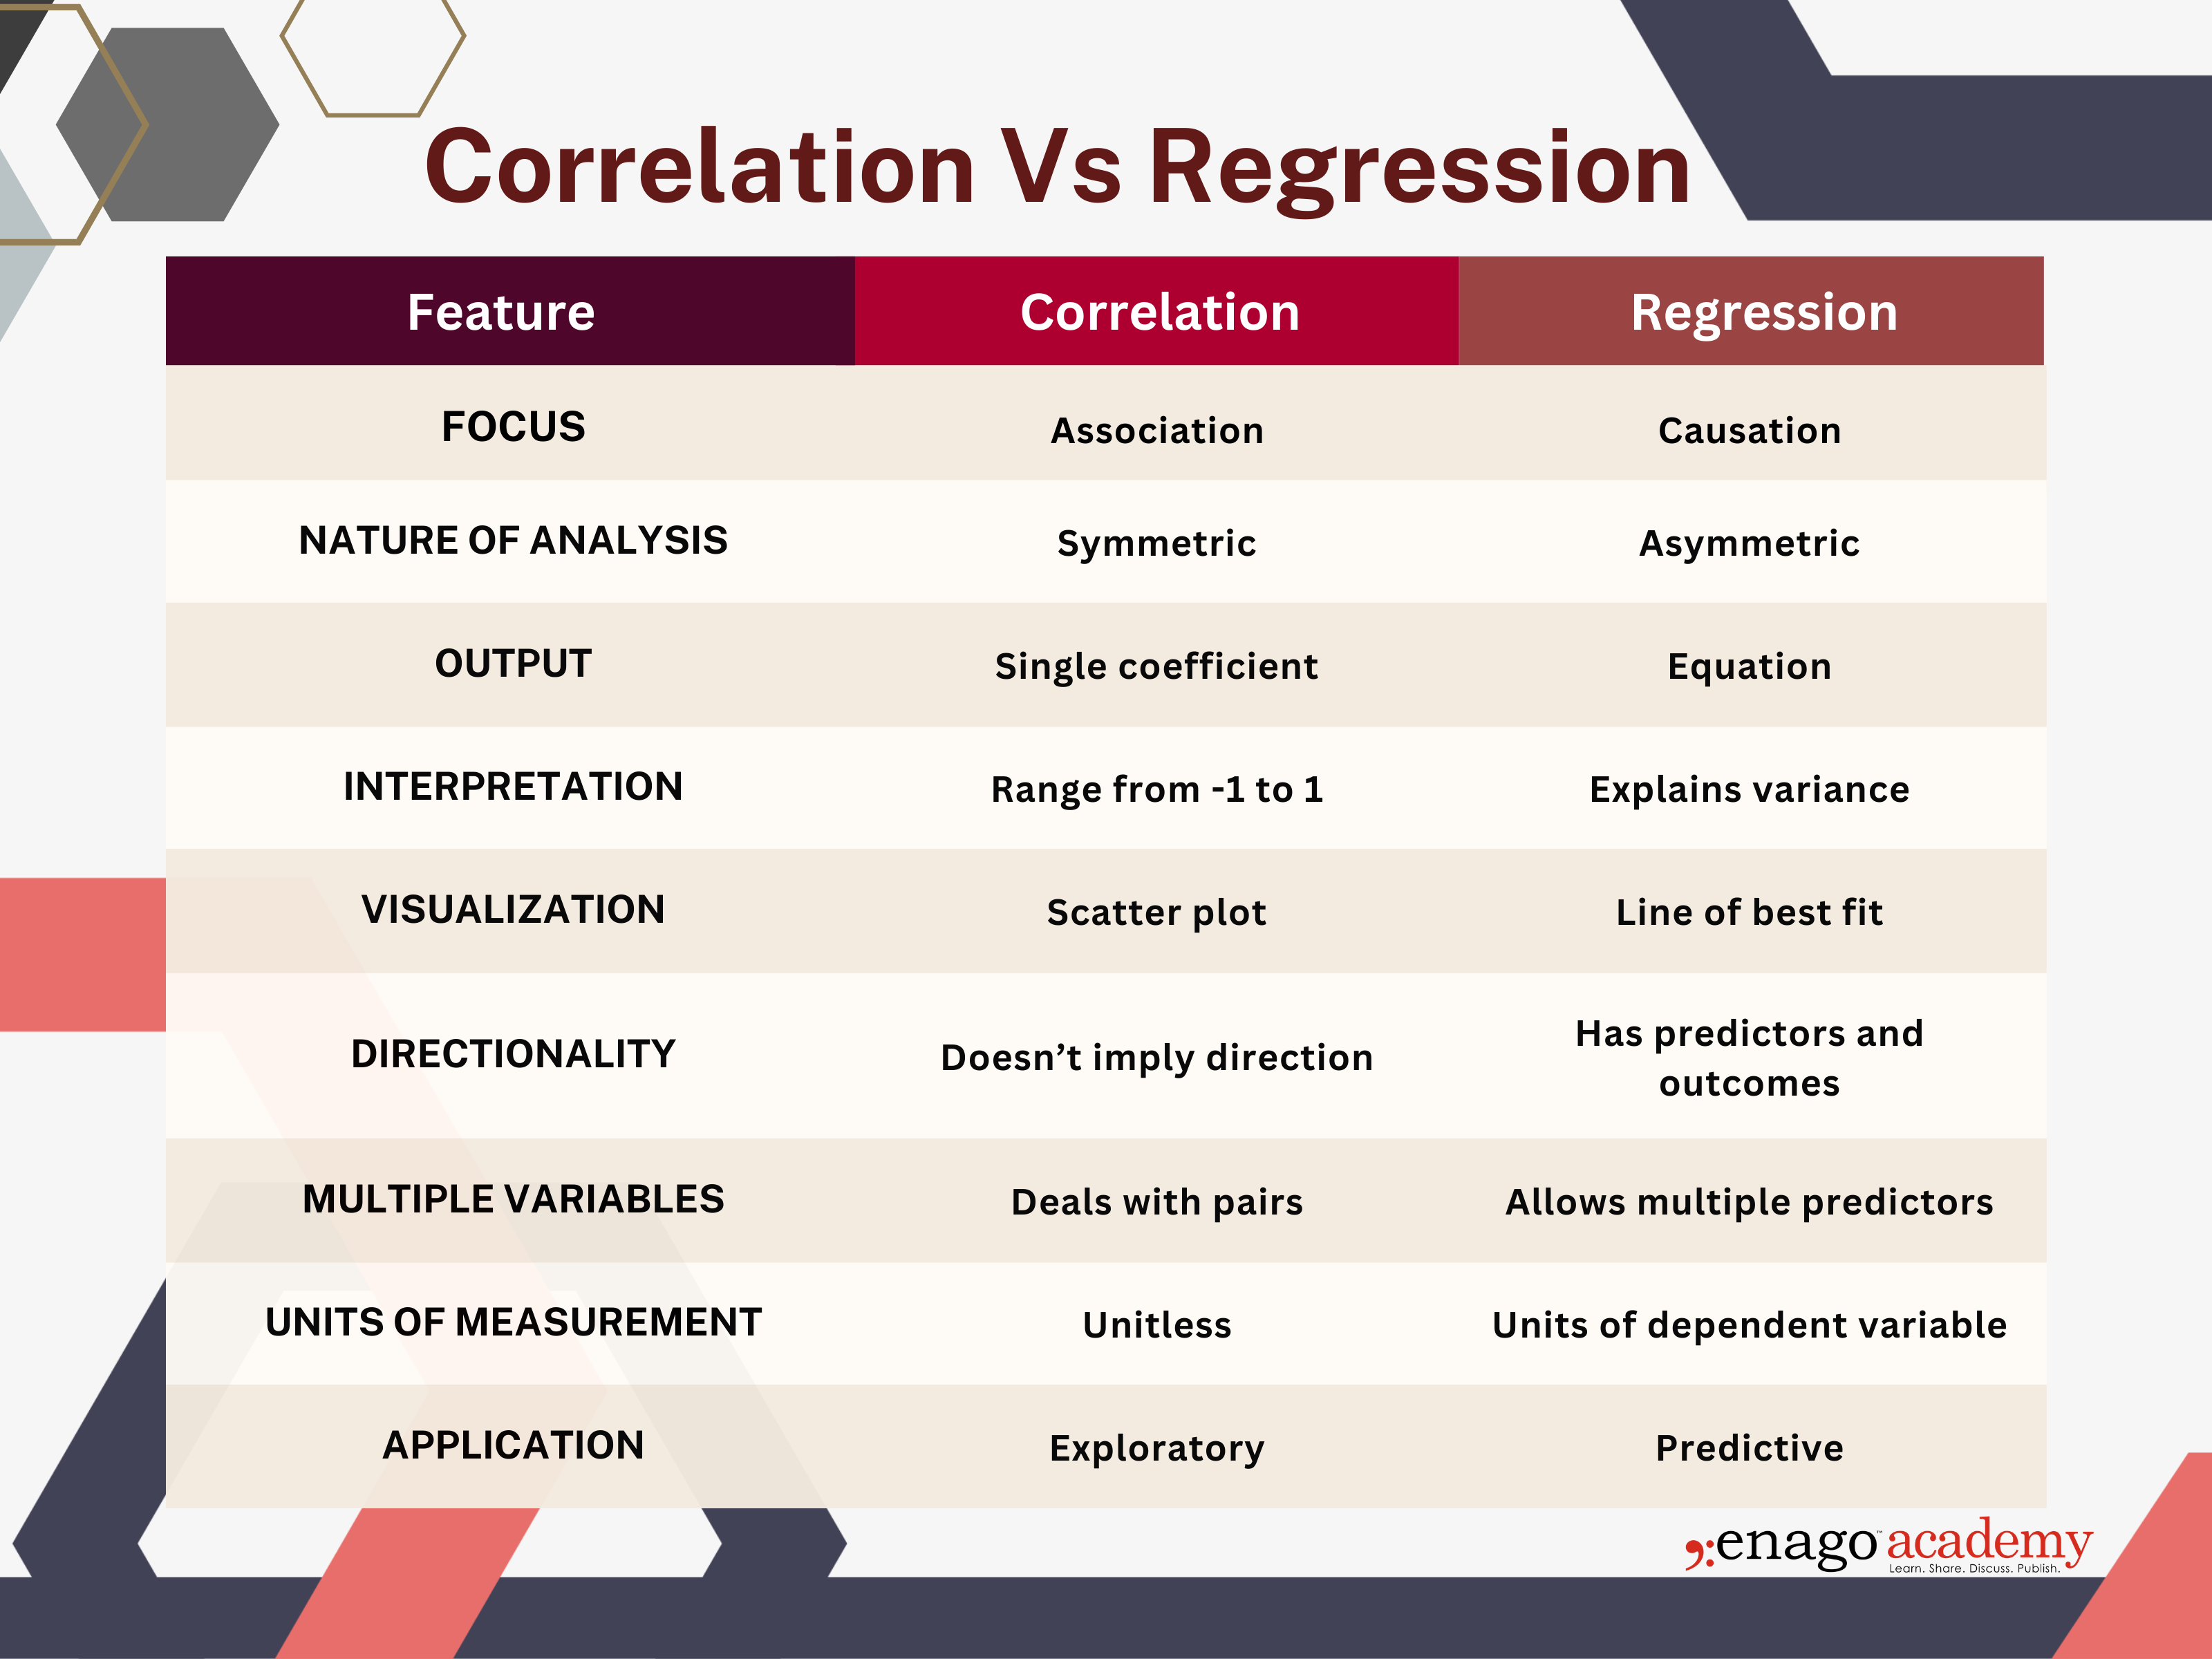
While regression helps predict the value of a dependent variable based on independent variables, it’s important to understand how it differs from correlation, which measures the strength and direction of a relationship between two variables. Let’s explore the key differences between correlation and regression.
Differences Between Correlation and Regression
The infographic below summarizes the key differences between correlation and regression.

Now that we have a clear picture of the types of correlation and regression and the basic differences between them, the next step is understanding when to use which!
How to Decide Between Using Correlation and Regression?
Let’s discuss each of their use cases with some real-world examples.
- Determining the relationship between height and weight in a population: In this instance, you must calculate the correlation. A positive correlation shows that as height increases, weight tends to increase. However, this is not a predictable situation.
- Determining the relationship between temperature and ice cream sales: Here you should use correlation. This is because though a positive correlation would suggest that as temperature rises, ice cream sales tend to increase, this scenario doesn’t predict exact sales numbers.
- Determining sales and advertising budget: Use regression to predict future sales based on the advertising budget. Analyze historical data to model how changes in the advertising budget affect sales figures.
- Determining employee performance and training hours: To assess how training time affects performance outcomes for targeted decision-making, you should use regression. This will help you predict employee performance based on the number of training hours.
Common Pitfalls and Misinterpretations
Let’s look at the common mistakes in correlation and regression and understand how to avoid them using some examples.
A common mistake is the assumption that correlation implies causation. Two variables may strongly correlate, but this does not mean one causes the other. For example, coffee consumption might correlate with productivity, but this does not necessarily mean drinking coffee increases productivity—it might result from another variable, such as the time of day. For instance, people often drink more coffee during work hours when they are expected to be productive.
Another mistake is misapplying linear regression models to non-linear relationships. In case, the relationship is non-linear (e.g., exponential or logarithmic), using a linear model can result in inaccurate predictions. For example, predicting the growth of a bacteria population over time. Bacterial growth often follows an exponential pattern, doubling at regular intervals resulting in an exponential curve. To model this accurately, you would need to use non-linear regression, which aligns with the nature of the data.
It’s essential to assess the nature of the data and choose the appropriate method to ensure valid results. Once you know which statistical measure you should apply, you can choose from several platforms to perform your statistical analysis.
Choosing the Right Tool for Accurate Analysis
Selecting the appropriate applications and tools is crucial for obtaining reliable results in research. You can use basic software like Microsoft Excel or choose advanced applications like PSPP, Matlab, and GraphPad Prism. These applications offer more robust capabilities for data analysis and can be used for larger data sets.
Are you looking for expert guidance on how to select the right statistical method for your research? Enago’s Statistical Analysis Service for Research Papers provides professional assistance and support to researchers who want to improve their analysis and ensure the accuracy of their findings.
Researchers can draw accurate conclusions and make better predictions by choosing appropriate statistical tools. Please share your experiences using statistical tools or any questions about using correlation and regression in your own work with us.


